Summary
Among the 24,234 U.S. ZIP Code areas I studied using 2023 data, areas with higher food insecurity also tended to have higher adult obesity, with a fairly strong relationship overall. Health teams might consider this pattern when reviewing community needs, while recognizing that it does not establish cause or identify which programs would reduce obesity.
Background
My research question was whether adult obesity is generally higher in U.S. ZIP Code areas with higher food insecurity. This question matters to care teams trying to understand the communities they serve and administrators considering where to focus further investigation or resources. Looking at these conditions together may help them see needs that could be missed when each measure is considered separately. I used the CDC’s PLACES: Local Data for Better Health, ZCTA Data, 2025 release, selecting the 2023 food insecurity and adult obesity estimates. ZCTAs are Census-defined geographic areas that approximate ZIP Code service areas; I refer to them as ZIP Code areas throughout this brief. The percentages are estimates produced from survey responses and population information, rather than direct measurements of every resident. They provide a community view, but they do not describe the circumstances of any particular patient.
Methods
I selected the food insecurity and adult obesity measures from the same CDC dataset and arranged them so that each ZIP Code area appeared once, with both percentages in the same row. Of the 29,983 areas in the reshaped dataset, 5,749 were missing food insecurity estimates and were excluded, leaving 24,234 areas for analysis. I checked the remaining data for missing values and duplicate area identifiers. I then examined a chart and calculated how closely the two percentages moved together, using an approach suited to comparing two numerical measures with a broadly straight-line pattern. Each area counted equally, regardless of its population, so the result describes a relationship across areas rather than across individual residents. The most important limitation is that this comparison can identify a relationship but cannot establish that food insecurity causes obesity.
Finding
In the 24,234 U.S. ZIP Code areas I studied using 2023 data, areas with higher food insecurity also tended to have higher adult obesity, with a fairly strong relationship overall. This does not mean food insecurity causes obesity, since other factors, such as poverty and opportunities for physical activity, could help explain the pattern. Local health teams might consider food insecurity when looking at community health needs, but this finding alone cannot tell them which actions would reduce obesity.
The chart shows this pattern through an upward trend line. Each point represents one ZIP Code area, and the spread of points shows that food insecurity does not explain all the differences in obesity. Areas with similar food insecurity percentages can have quite different obesity percentages. The overall pattern therefore provides context for understanding communities, rather than a reliable prediction for every area.
The finding also applies most directly to the areas included in the analysis. Nearly one in five areas in the reshaped dataset was excluded because a food insecurity estimate was unavailable. If those areas differ from the included areas, the relationship across all U.S. ZIP Code areas could look different.
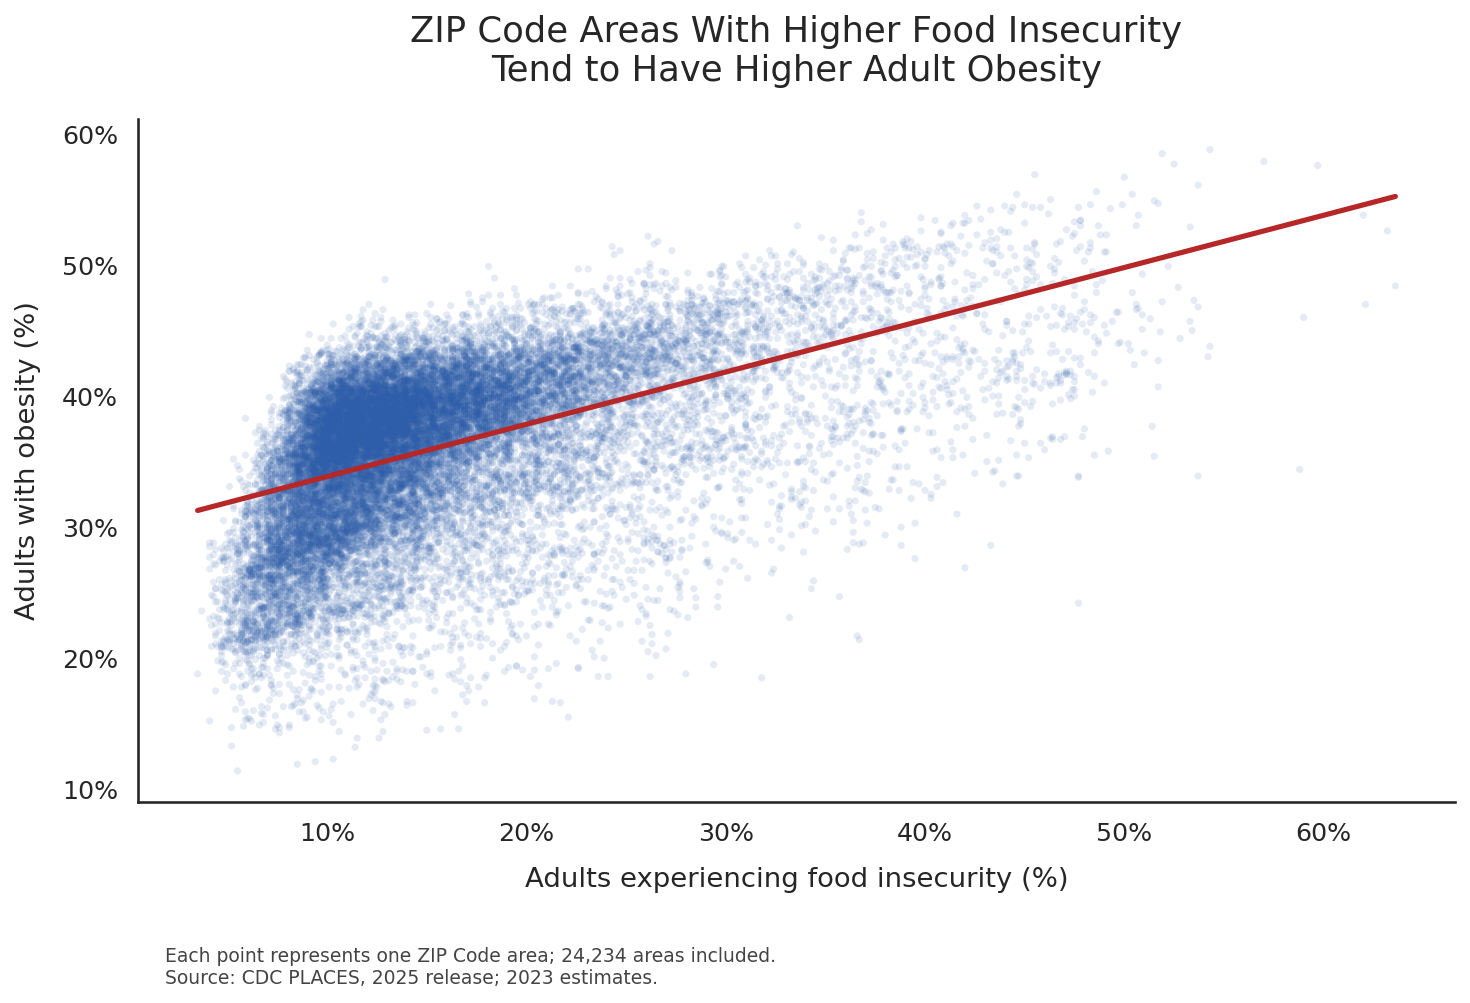
Chart caption: ZIP Code areas with higher food insecurity tended to have higher adult obesity, although obesity percentages varied widely among areas with similar food insecurity.
Implications
A TruBridge care team member might use this finding as a starting point for asking what food-related needs exist in the communities their organization serves. Community information could add context to those conversations, while individual needs would still require individual assessment. An area’s percentage cannot establish whether a particular patient experiences food insecurity or has obesity.
A healthcare administrator might consider reviewing local food insecurity estimates alongside existing community assessments and information about available services. This could help frame questions about unmet needs or possible partnerships with community organizations. However, this analysis did not compare programs, costs, or outcomes, so it cannot identify the best use of funding.
Before using the finding to support a specific decision, either reader may want to examine more local information and consider other community conditions. The practical value of this project is in identifying a pattern worth investigating further, while leaving room for evidence about what would be useful in a particular setting.